
First Ever Official GDP Stats Released for Every US County
The government has for the first time released official gross domestic product (GDP) statistics for ..
The government has for the first time released official gross domestic product (GDP) statistics for each and every one of the nations 3,113 counties.
The figures, released Thursday by the U.S. Bureau of Economic Analysis (BEA), span 2001-2018.
A year ago today, the BEA teased the official release of the GDP data with a set of prototype statistics. Secretary of Commerce Wilbur Ross said at the time that “the prototype data addresses one of the last remaining gaps in economic knowledge, offering policymakers and businesses a new tool to inform their decision-making.”
The BEAs new data provides a more detailed look at the geographic distribution of economic activity in the United States, helping analysts assess local performance and policymakers develop growth strategies.
Since the size of a countys economy as measured by GDP varies significantly across the nation, the county-level statistics will help answer important questions about the size and condition of local area economies, such as industrial composition and comparative growth trends.
The data shows, for example, that in 2018, real GDP increased in 2,375 counties, decreased in 717, and was unchanged in 21.
The total 2018 GDP level ranged from $18.4 million in Issaquena County, Mississippi, to $710.9 billion in Los Angeles County, California.
The percentage change ranged from 86.5 percent in Jackson County, West Virginia, to -44.0 percent in Grant County, North Dakota.

Gross domestic product estimates the value of the goods and services produced in an area and can be used to compare the size and growth of county economies across the nation.
Industry-level Breakouts
The newly published county-level GDP statistics include breakouts for private goods-producing industries, private services-producing industries, and the government and government enterprises industry group.
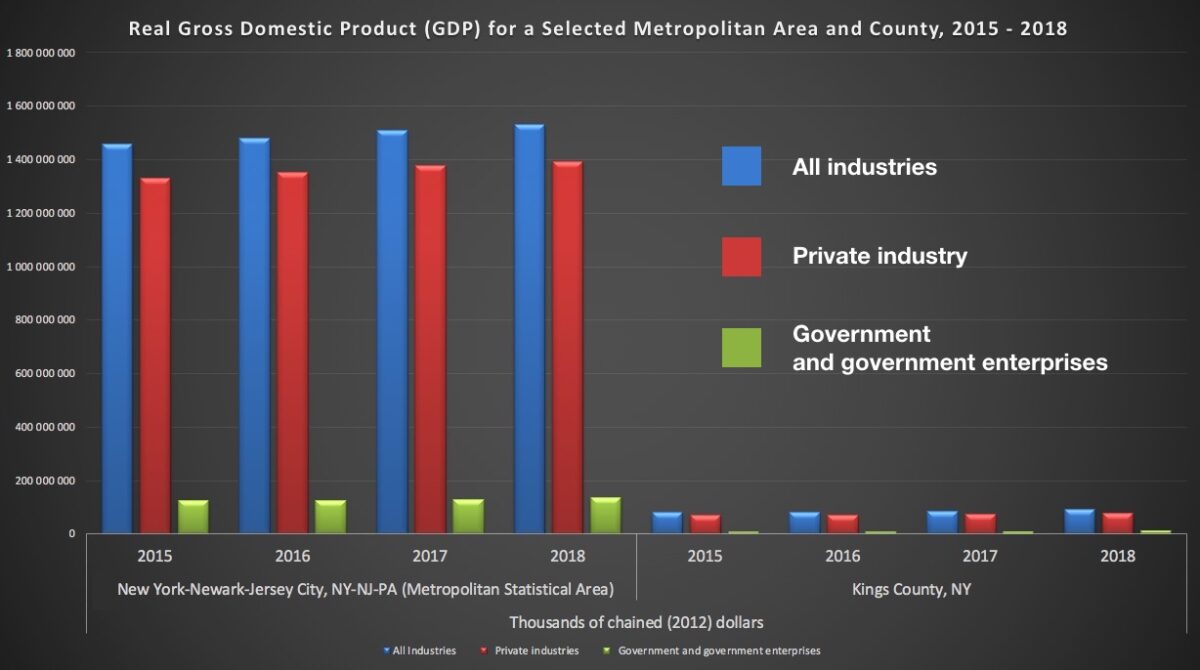
The new data can show such details as the relative contributions of private versus government industry to GDP. For example, in the New York metropolitan area—which in the BEA figures includes New York City, Newark, and Jersey City—the overall industrial contribution to GDP was $1.53 trillion in 2018. The private sector contributed the lions share of $1.39 trillion, while government and government enterprises accounted for $138 billion. This means 74 percent of GDP came from the private sector, compared to 26 percent from the government. By comparison, Kings County, New York, saw $77.7 billion from private industry versus $13.9 billion from the government sector, with private industry contributing 85 percent to GDP.
The figures can aid economic development strategies that target areas with the greatest need by identifying the strengths and weaknesses of local economies. County-level GDP statistics can also help understand the longer-term impacts of different development strategies.
Highlights
The 2018 county-level figures show that 96 percent of large counties saw real GDP growth, compared to 93 percent of medium counties, and 72 percent of small counties.
In the nations 141 large counties, those with populations greater than 500,000, real GDP in 2018 increased in 136 and decreased in 5.
Santa Clara County, California, was the fastest-growing county at 10.2 percent. IT was the leading contributor to the countys growth.
Kern County, California, had the largest percentage drop in GDP (-0.7 percent), with contraction in the mining, quarrying, and oil and gas extraction industry (primarily oil and gas extraction) being the leading contributors to its decrease.
GDP in large counties ranged from $11.2 billion in Pasco County, Florida, to $710.9 billion dollars in Los Angeles County, California.
In the countrys 464 medium-sized counties, those with populations between 100,000 and 500,000, real GDP in 2018 increased in 433, decreased in 30, and was unchanged in 1.
Canadian County Oklahoma was the fastest-growing county at 21 perRead More – Source